Air Pollution Risk in Newark
Newark, NJ
By Jacqueline Mitchell
air pollution, risk, development, clean air act,
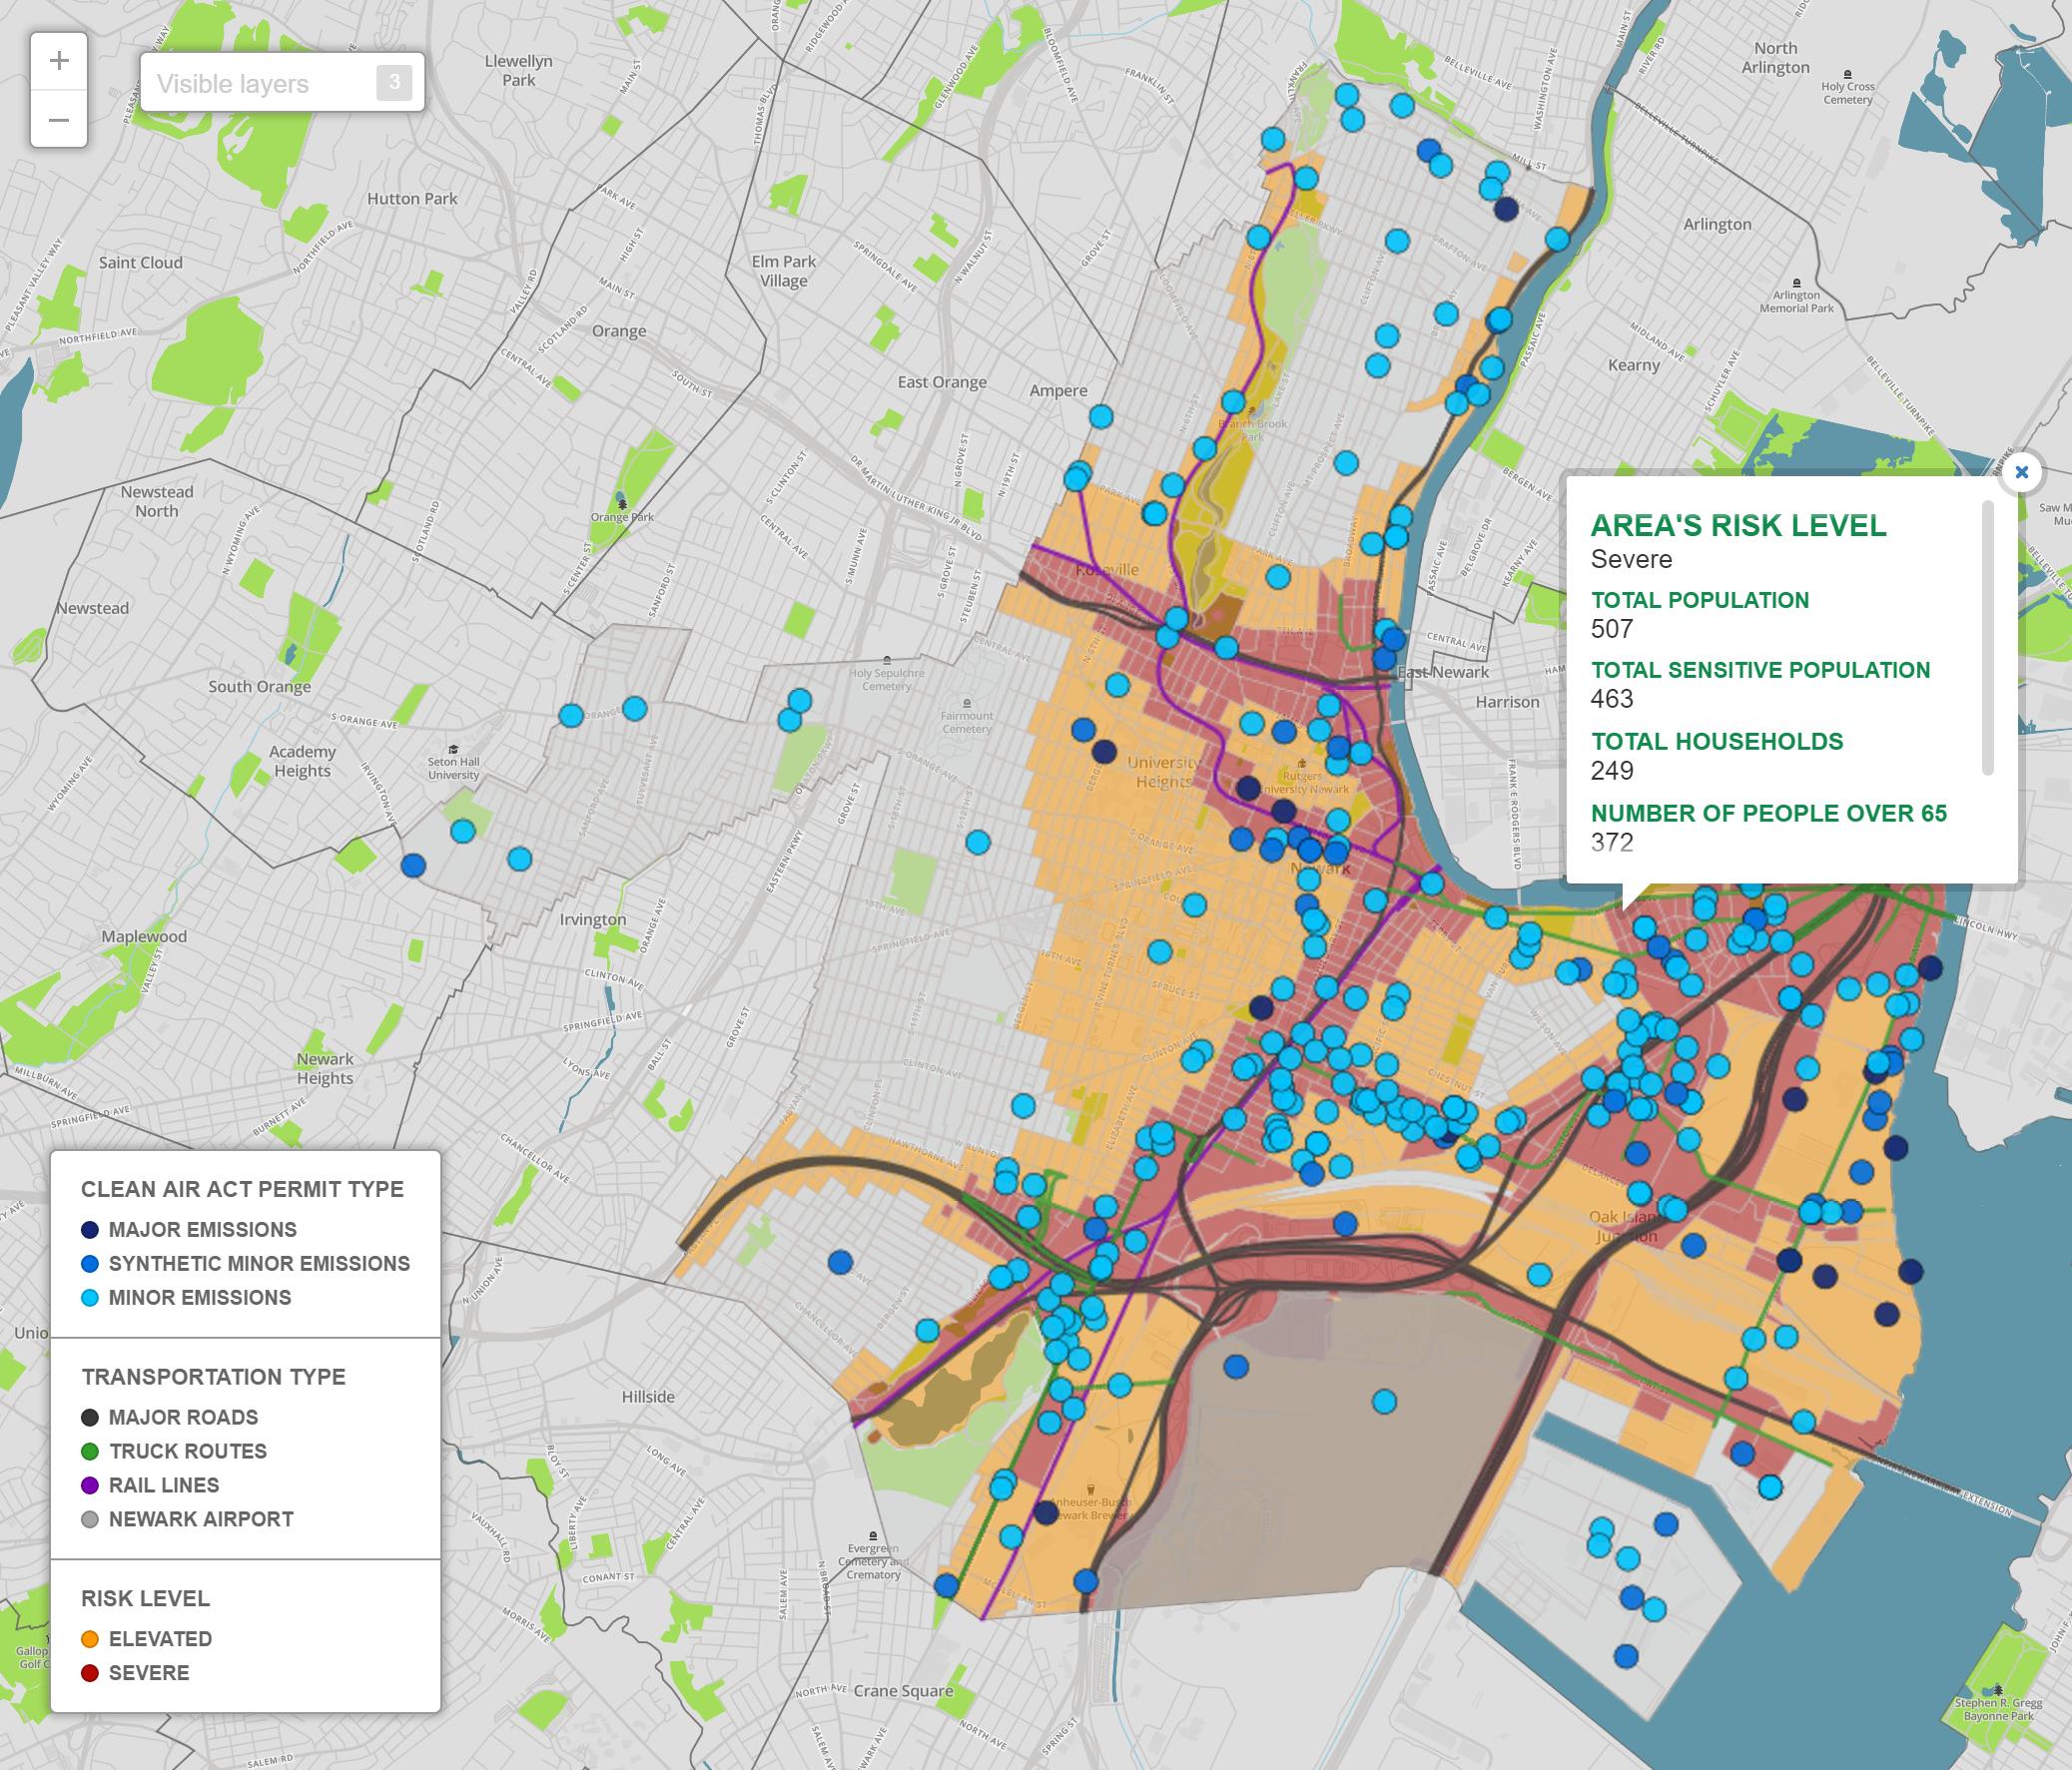
This map shows the different factors contributing to air pollution, identifies areas at risk and people affected.
Newark has had a long history of environmental problems due to its large industrial sector. Since the 1800’s there have been reports of poor water quality, illegal waste storage, toxic pesticide use and other problems.
This project was part of a larger project for the Newark Environmental Commission to create an Environmental Resource Inventory (ERI). An ERI is a “… compilation of text, tables, maps and other visual information about the natural resource characteristics and environmentally significant features of an area.” It involves environmental factors such as climate, air quality, geology, hydrology, land use, and several others. After a review of all of these features was done, air pollution was recognized as a critical problem in Newark.
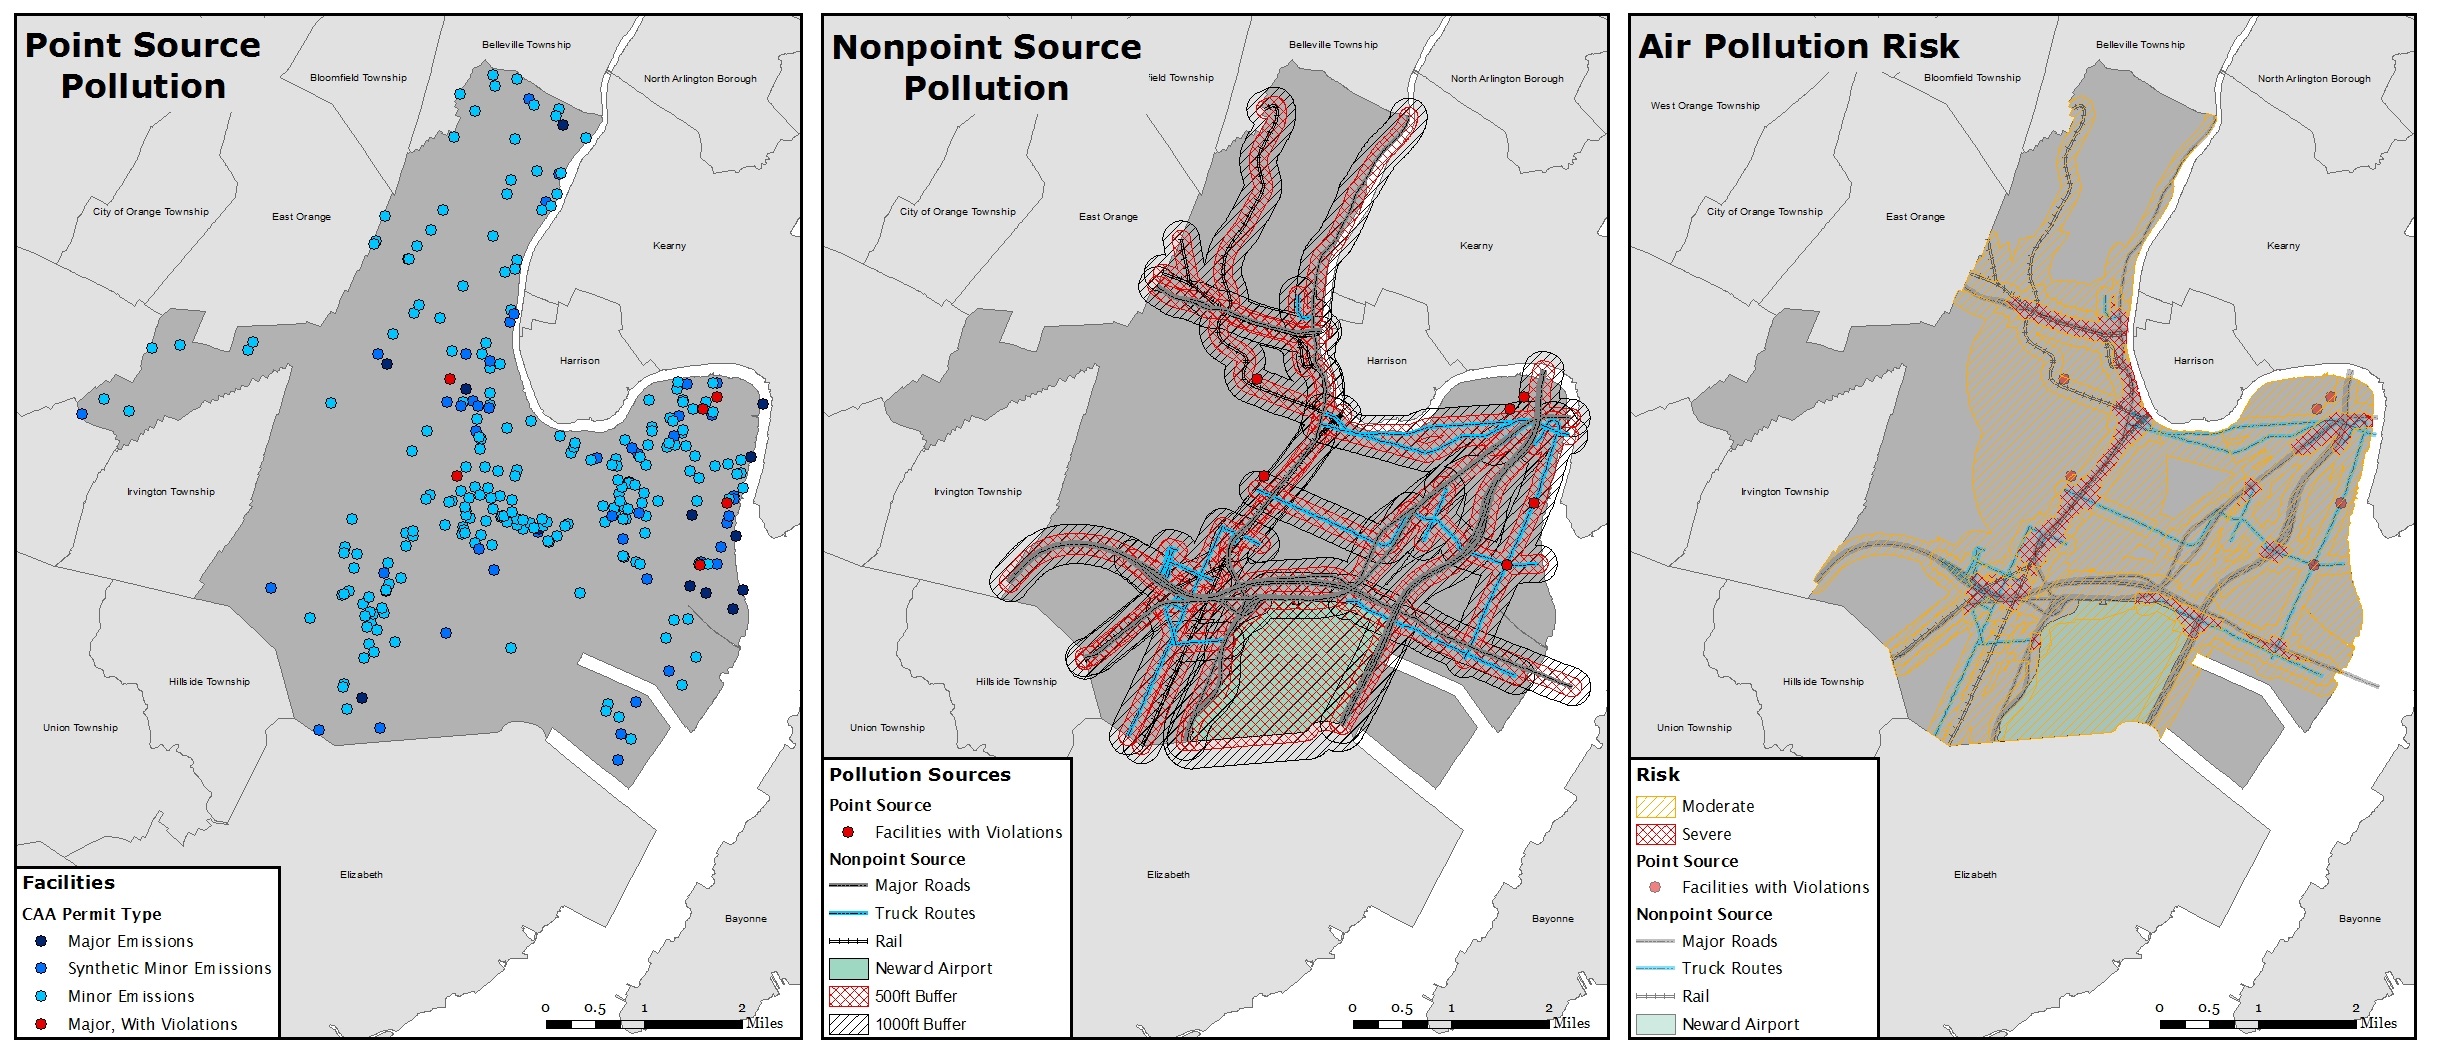
There are several factors that contribute to air pollution. Point sources, stationary facilities, and nonpoint sources, diffuse sources such as heavy traffic. These sources were used in the risk analysis of air pollution. Many studies have been done connecting proximity to point and nonpoint sources of pollution and degradation in air quality causing negative health effects. Increases in cardiopulmonary mortality, respiratory and cardiovascular diseases, prevalence of allergies, asthma, and eczema have all been associated with living in close proximity to major roads. Air pollutants such as nitrogen dioxide, sulfur dioxide, carbon monoxide, and black smoke are all in higher concentrations near major roads. Young people and adults 65 and older are at higher risk of being affected by poor air quality.
This project is an attempt to identify those areas of high risk and the people being affected by poor air quality. It can be used to inform the public about their risk and to influence policy makers and developers.
Air quality was analyzed using proximity to 5 factors: major roads, truck routes, rail lines, Newark airport are all nonpoint sources and facilities that have violated their major permit at least once within the last 3 years are point sources. Point sources were buffered 1 miles for the area of high risk, and 1.5 miles for the area of elevated risk. Nonpoint sources were buffered 500 feet for high risk and 1000 feet for elevated risk. Where multiple high risk areas overlapped were labeled areas of severe risk, areas where multiple elevated risk areas overlapped were labeled elevated risk. Since the census block and risk layers do not perfectly match, the census blocks were selected by those that have their centroid in the risk layer. These census blocks were used to identify the population at greatest risk of air pollution.
- Link 1 - jaxmit.github.io/2016/advancedGIS/adv_gis_final.html#